

How to Properly Simulate 10 cm Satellite Imagery

How Albedo employs a physics-accurate simulation process to convert aerial imagery into representations akin to what our satellites will capture from space in 2025.
With the inundation of AI and other image manipulation tools available today, the already ambiguous word “simulated” has somehow gotten even more murky. Was it “simulated’ by training a neural net on existing satellite imagery? Was it synthetic imagery rigorously generated using a validated physics-based model like DIRSIG? Or are we talking about Landsat data re-created as a playable map in Minecraft? “Simulated” gets tossed around as a technical virtue signal for any non-truth imagery but is rarely paused when encountered to examine what it really means.
Well, it’s a good thing we’re here to clear it up for you. Two things before we dive in:
- Albedo’s goal is to generate accurate simulated imagery before we launch that we can share with our customers, investors, and the general public as to what they can expect from our satellite once it’s in VLEO snapping photos. You know, the whole “a picture is worth a 1000 words” spiel. Towards that end, we wanted the imagery to be as representative as possible — in terms of resolution, image quality, and even radiometry. A substitute that is so close to the original product that you or your algorithms, as a consumer, effectively can’t tell the difference.
- We do not use any artificial intelligence/machine learning in this process. At the time of this writing, artificial intelligence is great for raw idea-generation, finding synonyms for a lot of the words you’ll find in this blog post, and many other things — but not for accurately simulating 10 cm imagery from space.
In this process, we follow first-principles physics to simulate the remote sensing process from truth scene (input imagery), to as-collected image, and to simulated Albedo image (output imagery).
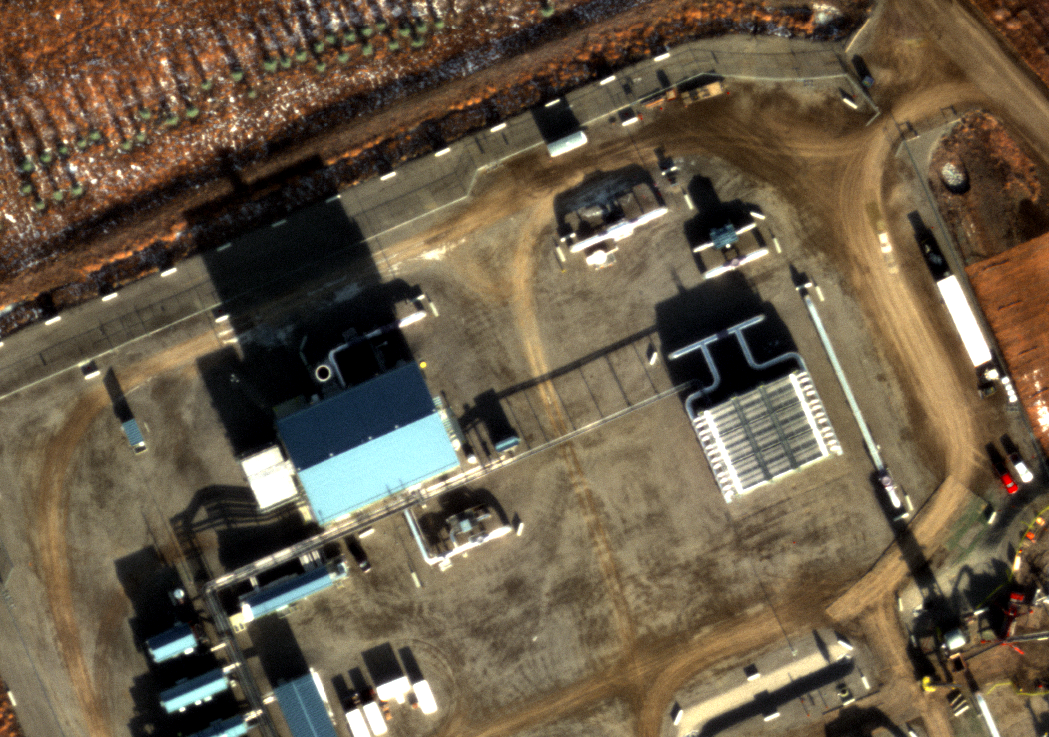
First, we start with our input imagery, typically surrogate aerial imagery collected from a plane or drone with varying resolution better than (≤) 5 cm, and orthorectify it to produce a common geometry to use in subsequent simulation steps. As a rule of thumb, the surrogate aerial imagery’s resolution must be at least twice as fine as your desired simulated resolution because you want the surrogate aerial camera’s properties to be negligible in the simulated imagery. The data in this input is surface reflectance, so that we can model the physics. This represents the truth scene we’re sensing with the Albedo system in this simulation.
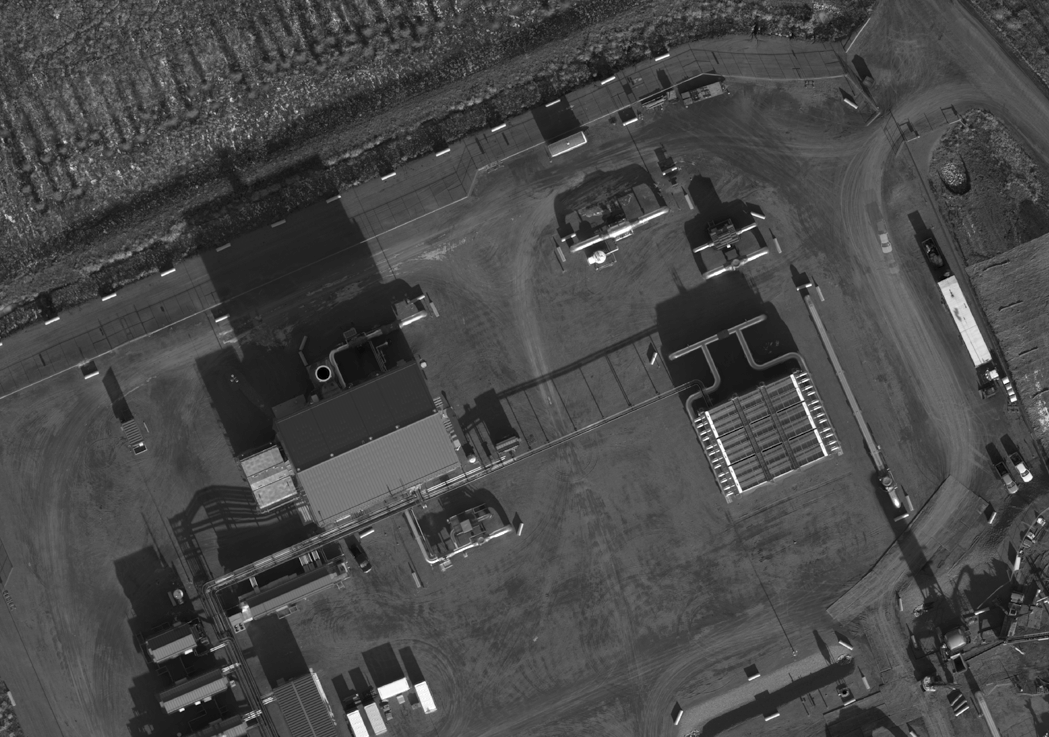
Second, we simulate the sampling of this truth scene through our telescope and slant range. This produces our 10 cm ground sampling distance with the application of system’s end-to-end Point Spread Function (accounting for all effects of telescope aberrations, detector performance, and platform motion), which has a blurring effect on the imagery, shown in the following image:

Third, this downsampled and blurred telescope output is sampled by the image sensor and turned into digital values. Here, we employ our radiometric math model to calculate image sensor digital counts from calibrated surface reflectance values, passing through the atmosphere and sensed through the system, and include the application of the numerous sources of noise present in the atmospheric scattering, system, and sensor. We perform this for each spectral band, and this now represents the as-collected image, as it would be on-board the satellite.
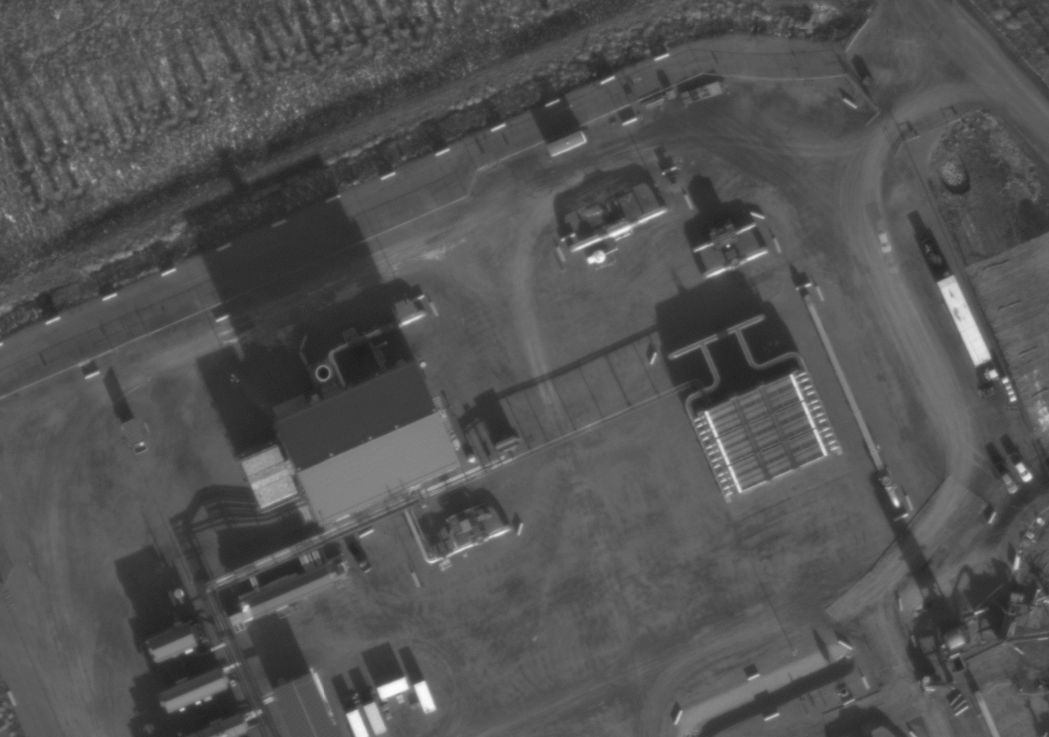
From here, we are no longer simulating physics but rather implementing our product processing pipeline. We perform physics-based sharpening and denoising to recover resolution present in the raw image. The finishing touch is a simple Dynamic Range Adjustment to bring image content into the dynamic range present in the output image. And voilà: a simulated Albedo 10 cm image!
And there you have it: an honest-to-goodness, veritable image of what you can expect Albedo’s satellite imagery to closely resemble in 2025. You can examine our treasure trove of simulated imagery, all produced with the simulation process we just outlined above, here using our Simulated Imagery Viewer.
More simulated imagery scenes
Highlighting a few scenes from an aerial image collection in Calgary:
Shown above is the Shell, Jumping Pound gas plant in Alberta, Canada. Associated wells and pipelines from the gas fields feed these plants, as you can see with the piping imaged to the right. Oil and gas companies are required to monitor their pipelines on a regular basis to look for things like leaks, damage to or interference with pipelines (purposeful sabotage, and locals tapping the line for free gas 🫣), as well as naturally occurring hazards like landslides and vegetation overgrowth.
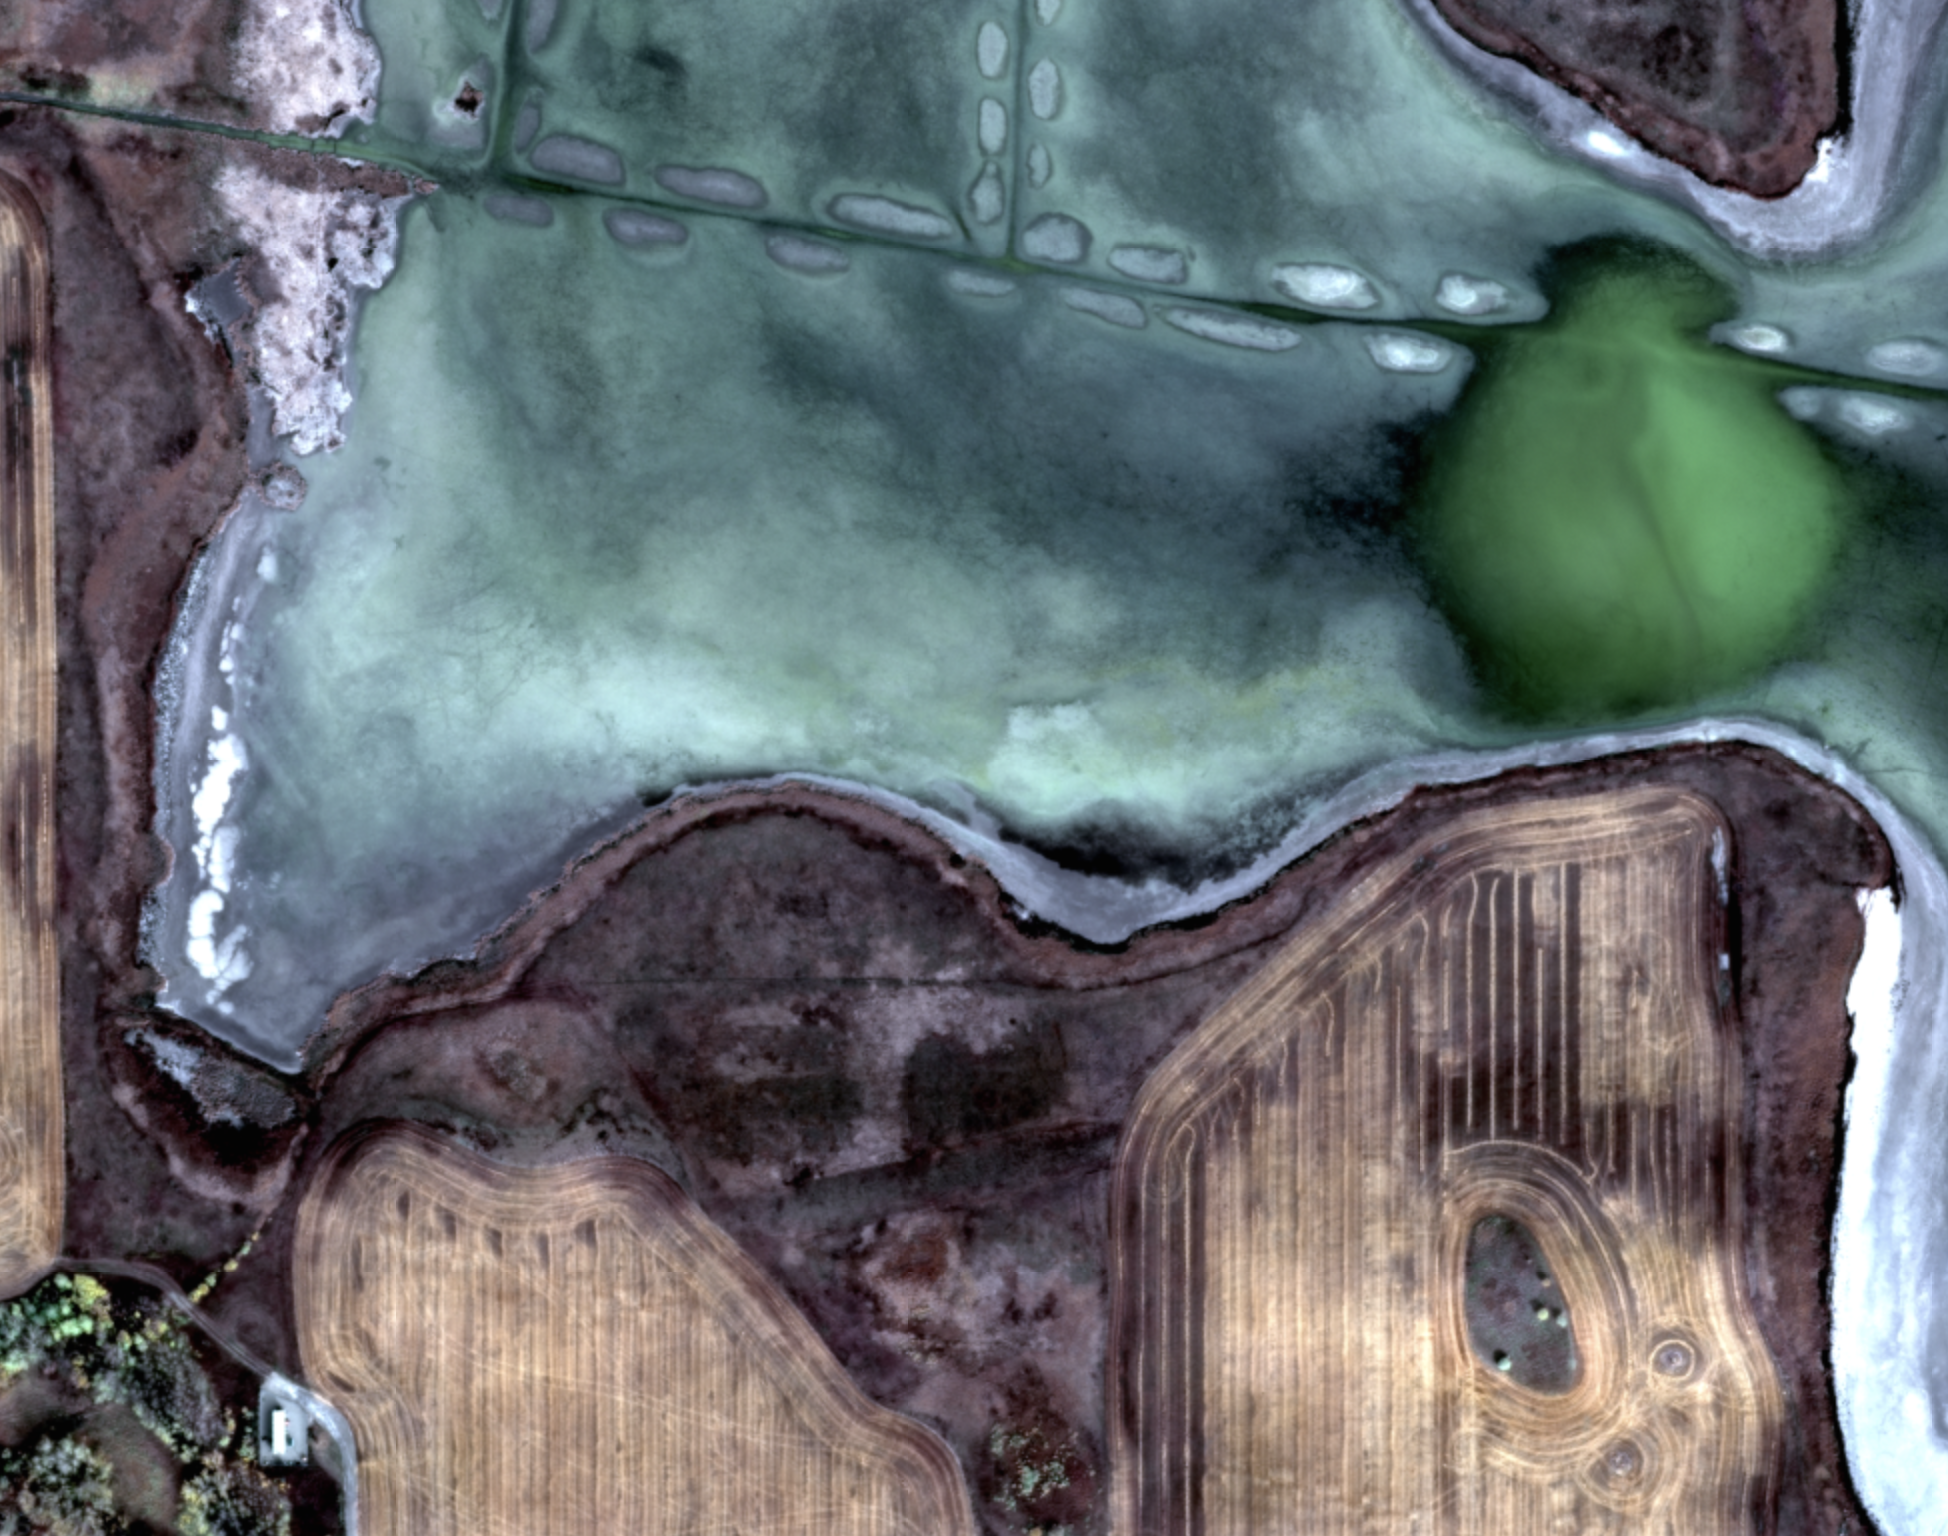
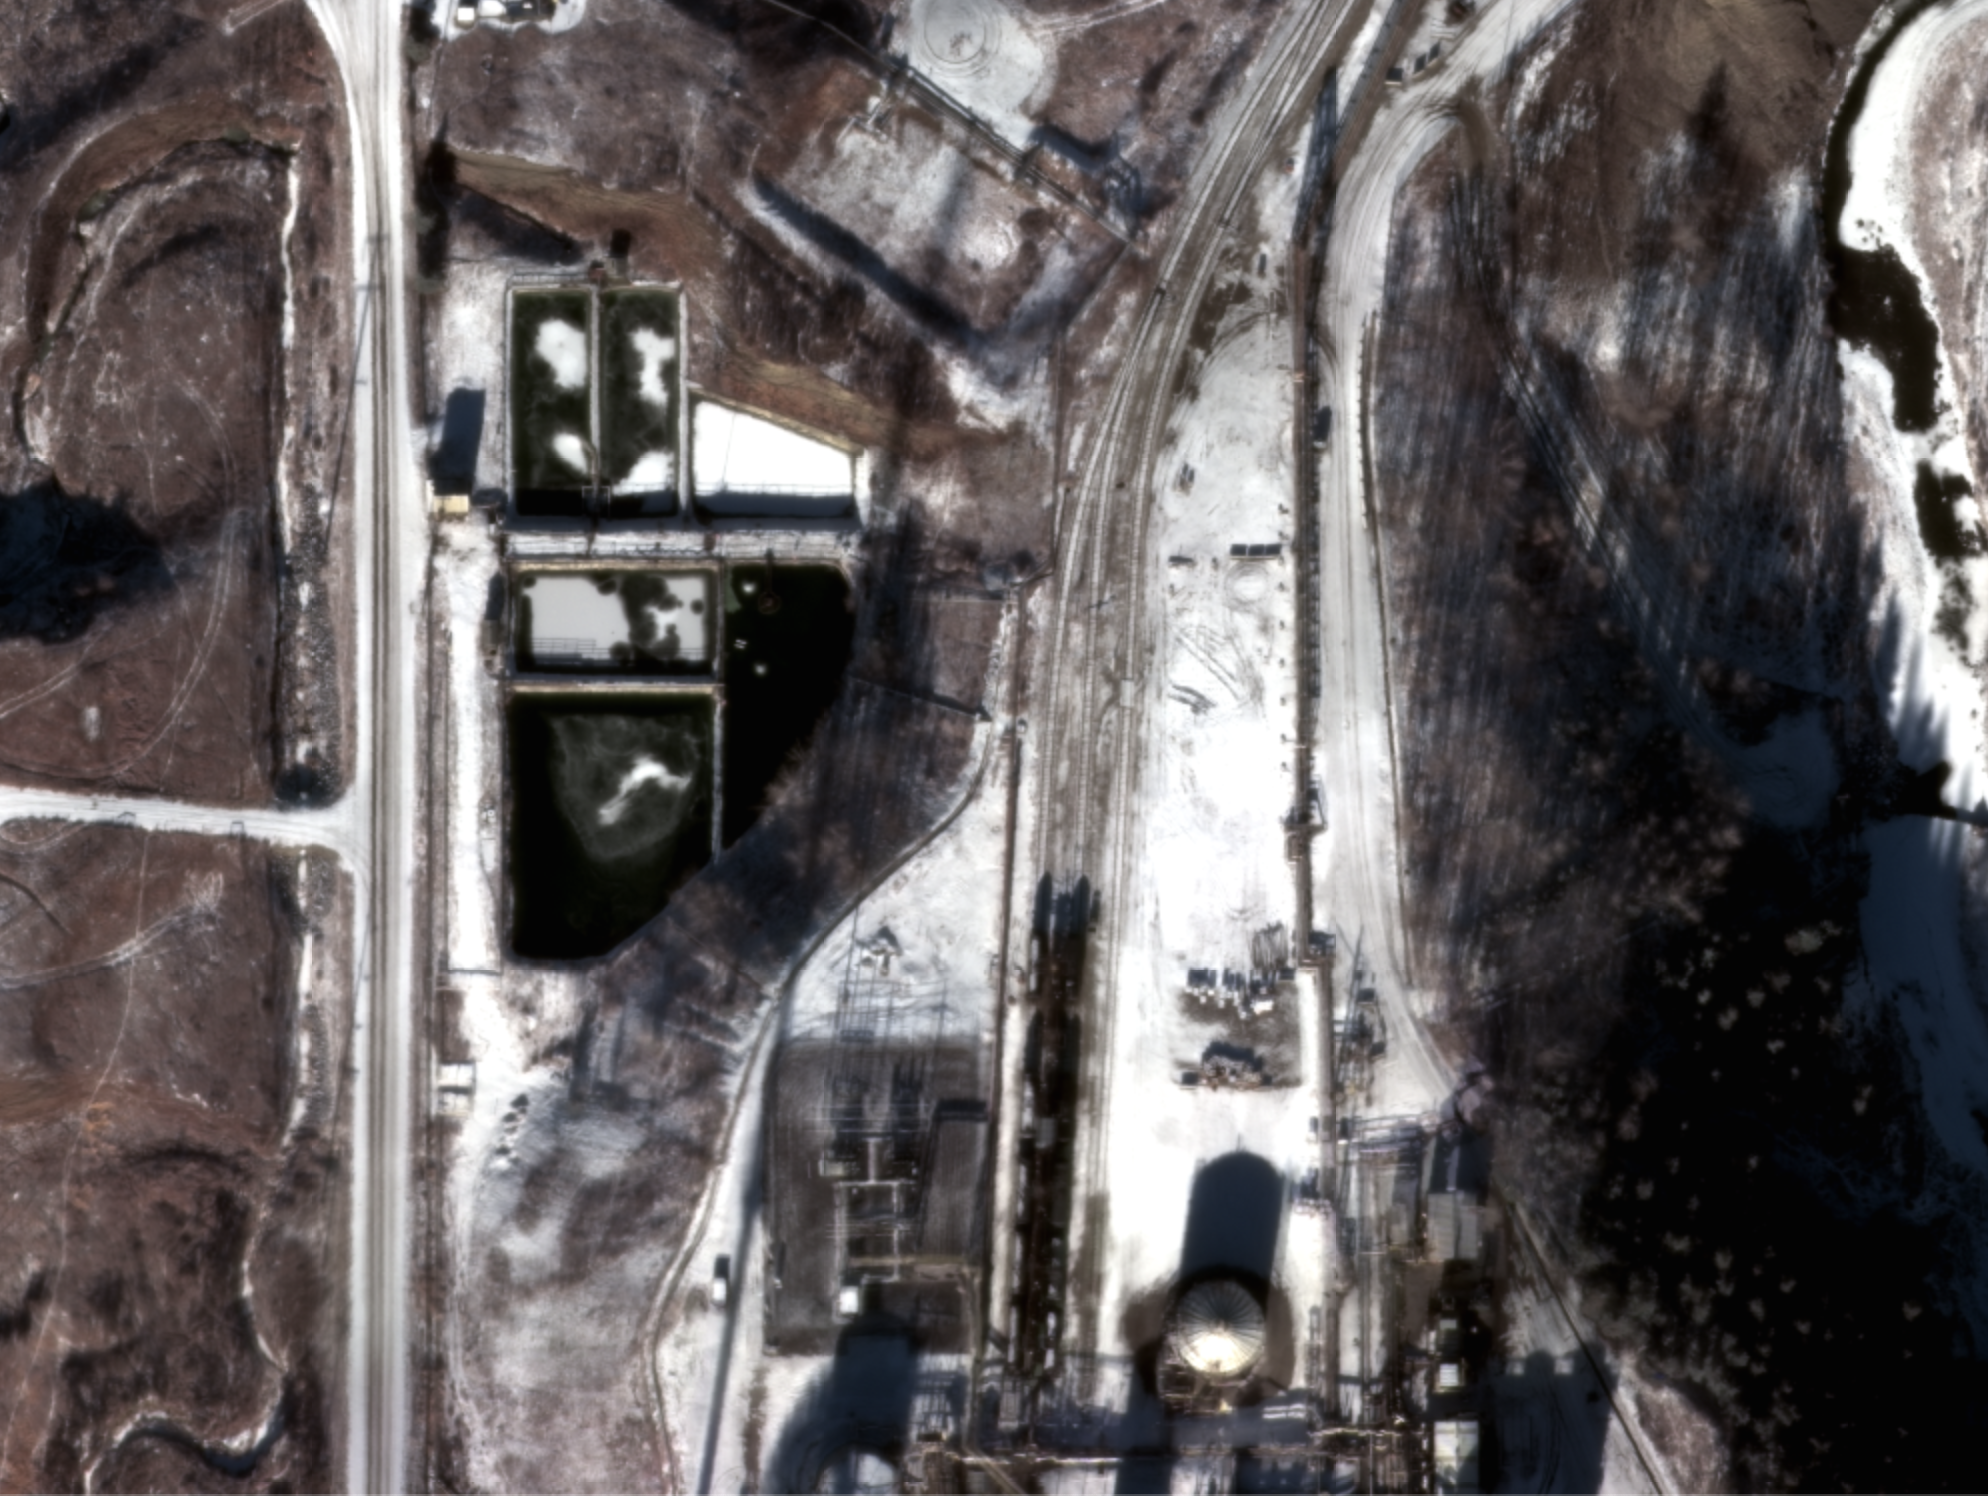
Fun fact about Weed Lake (the wetland pictured above): the original lake was drained for agriculture, but since 2006 it has been restored and is now a thriving, healthy, wetland ecosystem yet again.
Taking a closer look at our 10cm res imagery, you’ll see some pretty neat tidbits regarding the lake waters and surrounding fields 👀.
- The green areas of the lake show where the lake waters are deepest, with probable growth of algae 🌱. Meanwhile, around the shallower edges, there is a white layer of salt buildup contributing to the lighter blue hue.
- With the surrounding fields, precision agriculture is of great importance! 10cm visible imagery with the addition of NIR and LWIR bands has the potential to provide a near ideal set of data to better understand the details of specific crops within a single field.
- The LWIR data can also be useful for understanding soil moisture and temperatures that may require watering, or other crop maintenance.
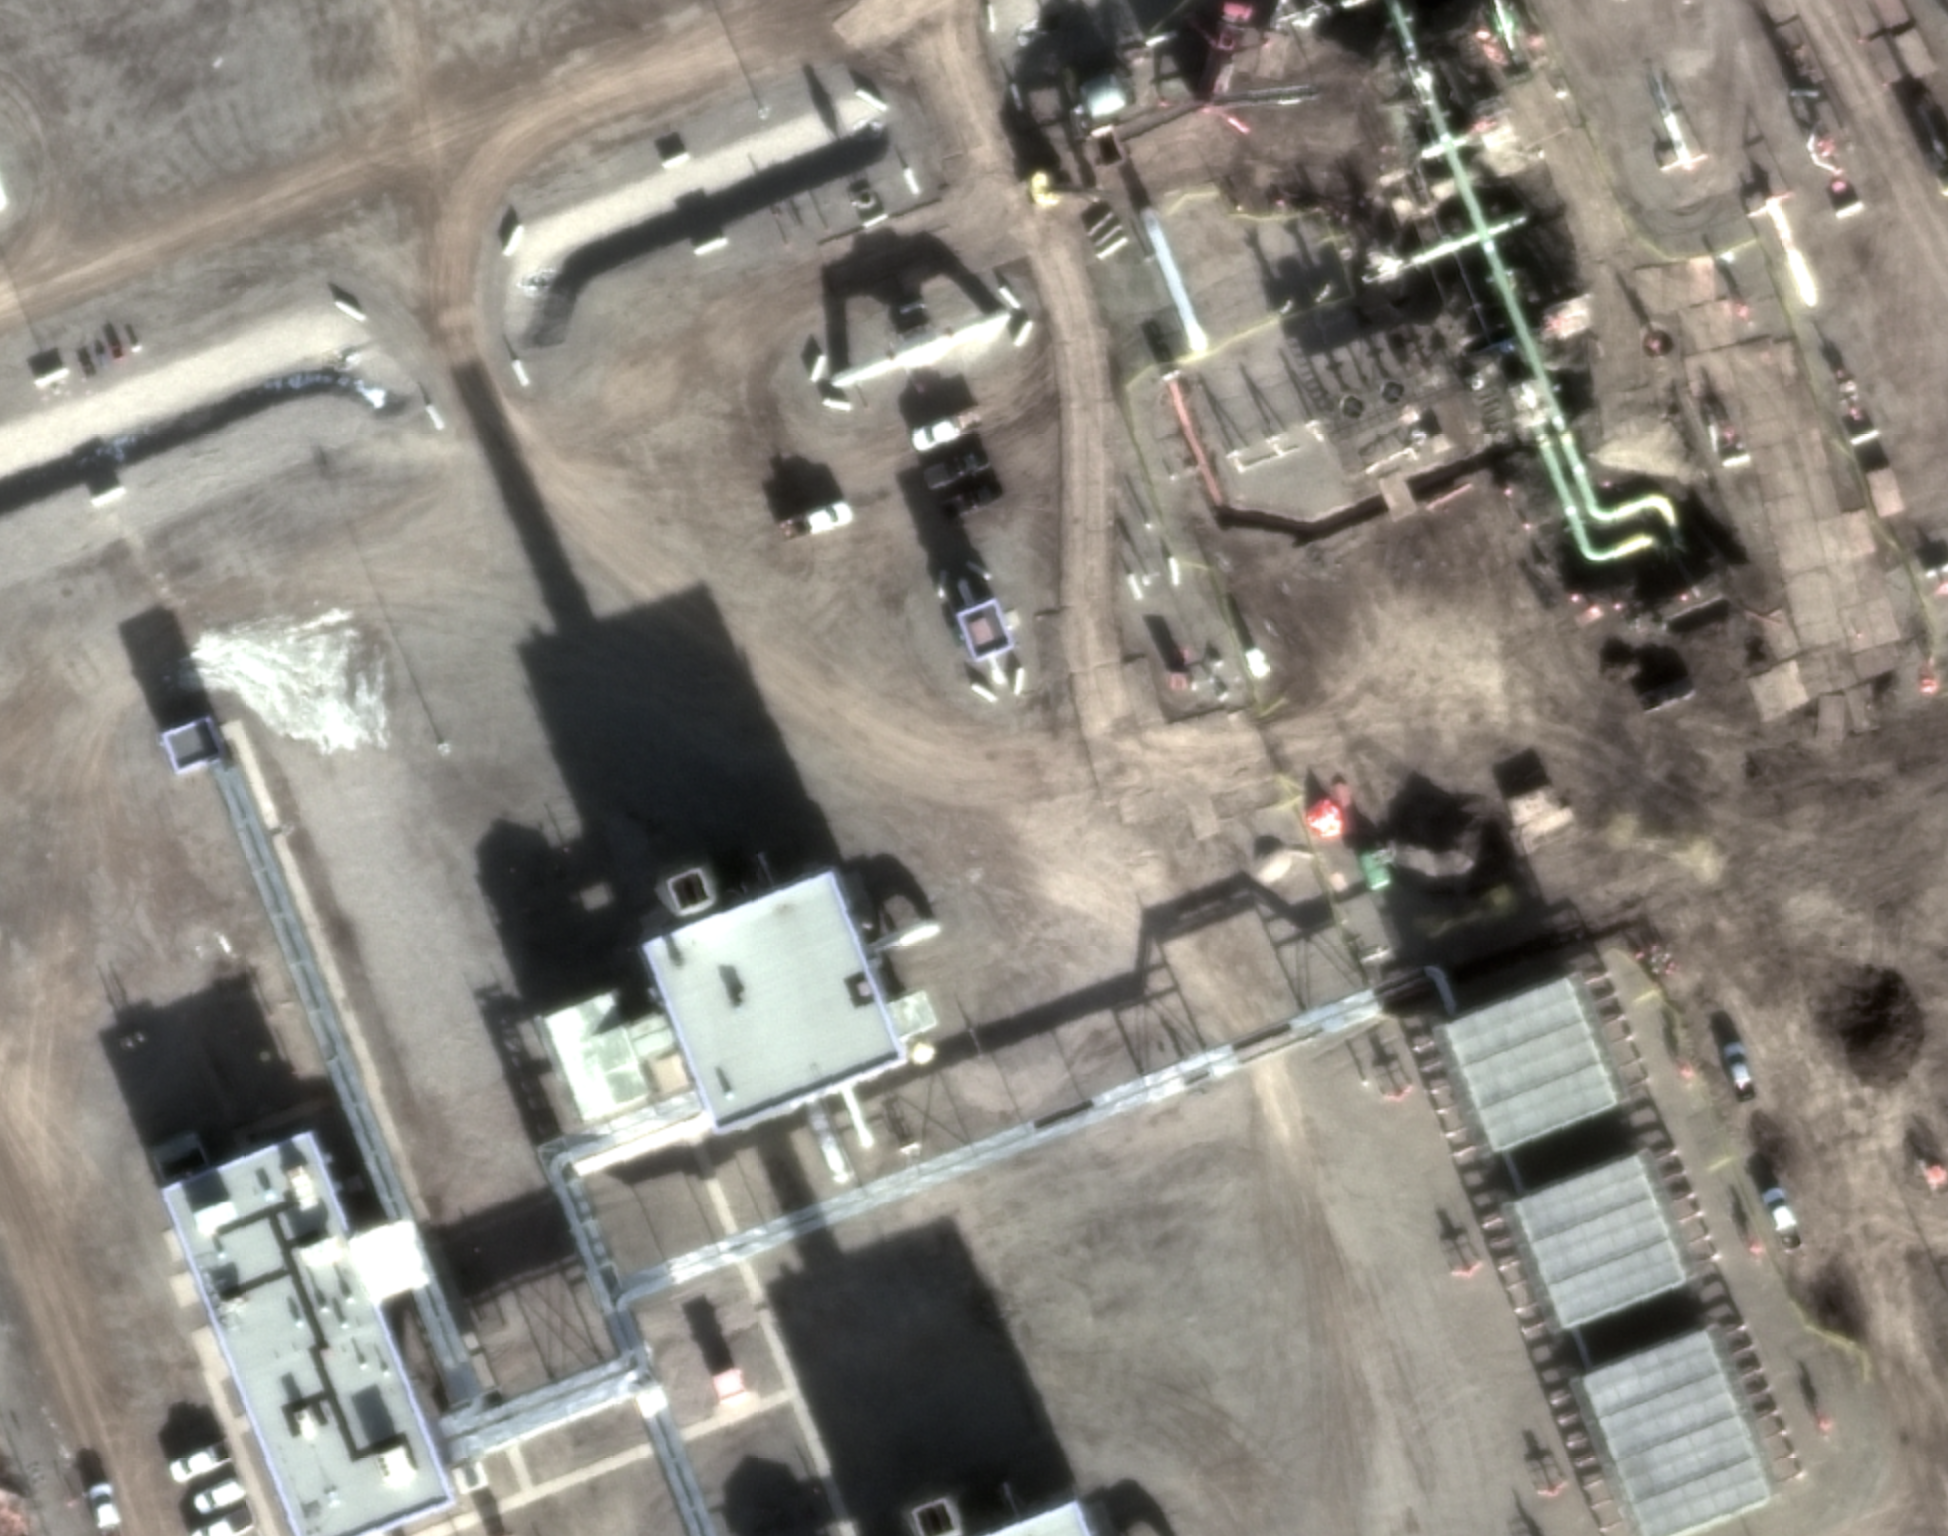
Depicted above is the Turner Creek natural gas compression station, operated by TC energy. This project aims to supply southwest Alberta (🇨🇦), as well as downstream North American markets, with natural gas that is produced in Western Canada.
Monitoring these sorts of assets is vital, but also tedious and resource-consuming when pipelines and sites can span up to hundreds of miles. Satellite imagery — especially long, linear imagery produced by Albedo's scanning system — is able to help reduce costs on these monitoring efforts, in a manner that is scalable across the globe!
As we continue to share simulated imagery into the future, you can rest assured that it was generated in this physics-accurate, rigorous process (and not hallucinated via AI). Make sure you’re following us on LinkedIn, Twitter, and Instagram as we share more simulated imagery ahead of our 2025 launch!

